This post was authored by Amrik Cooper, Platform Product Manager at SurveyCTO. The research that is discussed was originally presented at the annual American Association of Public Opinion Research (AAPOR) conference in Chicago in 2022.
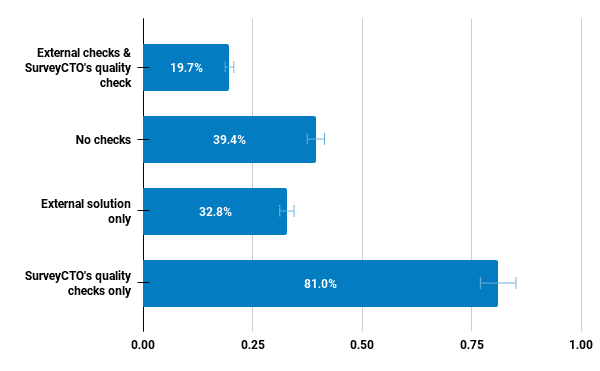
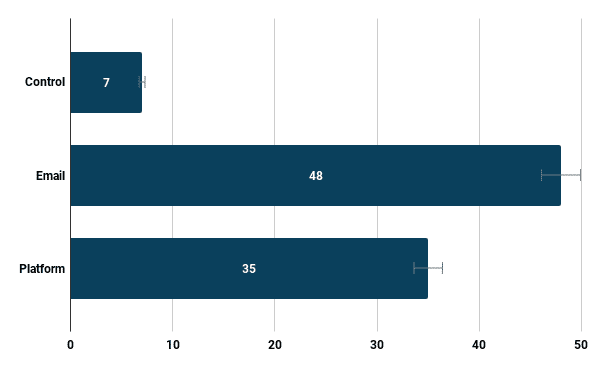
In this research, we investigated the low frequency of automated quality check usage and ran an experiment to nudge users toward quality check creation. In the experiment, users received either an email or in-platform nudge toward automated quality checks. The experiment was successful at a statistically significant level, but had a low yield in automated quality checks generated. Users were also asked about their use of statistical data quality checks as a survey data quality control measure during a survey. The survey showed that ~50% of respondents weren’t familiar with automated quality checks, that more users (~50% vs. ~25%) employ off-platform statistical data quality checks rather than automated quality checks, and that ~40% of users do not do any statistical data quality checking at all.
Reflecting on some recent research undertaken by the SurveyCTO product team.
Feature usage frequency is not always obvious to interpret. While SurveyCTO has some very popular features that are used on a daily basis by users launching and managing data collection projects, some features see less usage than we might expect. Given our focus on data quality-promoting features, we have been curious about historically low levels of use for automated quality checks. We felt that in this case, the usage frequency was lower than it should be, and that users could be seeing more value. We decided to try to find out the reasons why, and also to run an in-platform experiment to see if we could encourage more users to engage with the feature.
First though, how much is too little and how much is about right when it comes to a feature like automated quality checks? This feature helps users detect problems in collected data by using statistical tests based on the distribution of data. Thousands of projects are active on the SurveyCTO platform each month, actively collecting data. However, in the six months prior to our in-platform experiment, an average of 59 automated quality checks per month were created, with a standard deviation of 52 quality checks. Considering that several quality checks per form could be helpful, we’ve been more than curious about its level of use.
To help us understand, we explored self-reported use of statistical quality tests for data quality using solutions outside SurveyCTO in a user survey (n = 235; ~4.4% of users who visited pages the survey was embedded on). The following figure shows usage of automated quality checks against use of external solutions. Almost 40% of users didn’t use quality checks at all. Also, about four times as many users make exclusive use of external solutions, rather than our quality checks.

Sometimes, on a richly-featured platform, the issue is simply that users are not aware of all of the options available to them. We see evidence of this from the user survey, where around half of respondents weren’t familiar with automated quality checks. With that in mind, let’s consider the in-platform experiment we built into the platform. Users would receive either an in-platform or email “nudge” to create a quality check after they deployed an update to a form design where at least one form submission had been made. With one form submission, we were more confident that users were ready to think about data quality.
Were the experimental nudges effective? Yes, they were. In the graph that follows, you can compare the rates of automated quality check creation with the control group who received no nudges. The difference between nudged user behavior and the control group was statistically significant (p < .0001), but the net effect was modest, with nudged users creating a net surplus of 69 quality checks.

One of the apparent contradictions in this research is that 80.42% (95% CI [75.31% 85.53%]) of SurveyCTO users claim to be notably concerned about data quality, but almost 40% (95% CI [32.52% 46.25%]) of users don’t do any sort of statistical data quality checking to look for problems in collected data. At the same time, a relatively small number of users could be encouraged in practice to create automated quality checks.
What we learned
We took several other insights and reflections resulting from the research:
- We still don’t have highly confident knowledge of what the optimal level of quality check creation is, though we do think the total still appears too low. Not all forms would be designed for purposes that would necessarily benefit from statistical data quality checking, which may explain some — but we don’t believe all — of the ~40% who don’t employ any statistical checking.
- While some users do use other software in place of automated quality checks, there’s also overlap with automated quality check usage (~20% of survey respondents; 95% CI [14.1%, 25.28%]) so it isn’t entirely a replacement behavior.
- Quality checks were most popular with users who also used external software tools for statistical data quality testing. 37.5% of external solution users used automated quality checks too (95% CI, [28%, 46.9%]).
- The email treatment was more effective than the in-platform treatment (p = 0.0092).
- It is possible that our trigger event in our experiment (a qualifying form update) didn’t map well with the most ideal point for users to consider data quality control. Future attempts to nudge user behavior might benefit from building an optimal point into user workflows at which to guide them.
- It is possible that on many projects, a separate team member from the one who maintains form designs is responsible for managing data quality, and our experiment managed to miss these people (in spite of the potential for users who received the experiment treatment to communicate with their colleagues). Future attempts to encourage adoption of a feature could try to be more targeted, to reach a different team member.
We look forward to further experimentation in the platform to help find a way to make it even easier and more intuitive to collect higher-quality data.
If you’re interested in learning more about this research, write to amrik@surveycto.com. Equally, if you’re a SurveyCTO user and have any feedback or thoughts to share related to this research, get in touch. Your insights would be welcome.


