This post was authored by Ryan Fauber, Senior Product Lead at IDinsight and a SurveyCTO super user. He shares lessons on how IDinsight uses integrations and workflows to manage their large-scale household survey projects in India, as well as pro tips for SurveyCTO users to apply to their own projects.
Large-scale surveys are often hindered by operational challenges that only emerge as the survey size, geographic spread, or complexity increases. At IDinsight, we’ve used SurveyCTO’s integrations to create workflows that help us improve how we monitor and manage our household survey fieldwork in near real-time. In this article, we share our approach and specific techniques to help you do the same.
Our approach
IDinsight is an advisory and data analytics organization that helps global development practitioners maximize their social impact. We tailor a wide range of data and evidence tools, including randomized evaluations and machine learning, to help decision-makers design effective programs and rigorously test what works to support communities.
Our Data on Demand team is focused on dramatically improving how primary household data is collected by tackling aspects of the process that are slow, expensive, and difficult to manage. We have reduced the cost and time required to conduct large-scale data collection exercises by, among other changes, adhering to these three rules of data management:
- Automate repetitive data processing tasks.
- Decentralize field operations management.
- Communicate frequently with your team using automated messaging.
These guidelines have also helped us run increasingly large surveys. For example, we are currently conducting a survey that is simultaneously operating in eight states and 27 districts in India, covering 160,000 respondents every 4 months.
Fortunately, our use of SurveyCTO supports these goals. We have been able to seamlessly connect the data we collect on the SurveyCTO platform to external databases and management tools. Using our three rules as a framework, these integrations and workflows have significantly decreased the amount of time spent manually managing field processes, without decreasing the quality of the data collected. They have also led to novel uses of SurveyCTO, as well as improvements in quality, cost, and speed.
In this post, we share tools and techniques that are relatively easy to implement without too much technical expertise. While some of our insights might not fully apply to smaller surveys, the principles of automation, decentralization, and communication can help any team improve quality and reduce costs. This is also a starting point to explore more advanced applications of these principles: from machine learning-powered data cleaning algorithms to custom smartphone applications. We hope to explore those approaches in future posts!
1. Automate repetitive data processing tasks
As data collection projects scale up, it becomes increasingly difficult to process data in near real-time in order to direct field operations. SurveyCTO offers two types of integrations—direct streaming to Google Sheets and a more technical API— that make this process far more efficient. Imagine any member opening a dashboard from anywhere in the world and being able to know how many surveys are complete, what payments need to be processed, which teams need more resources, and what questions in the survey are causing confusion. These are all possible with SurveyCTO’s live integrations!
Google Sheets
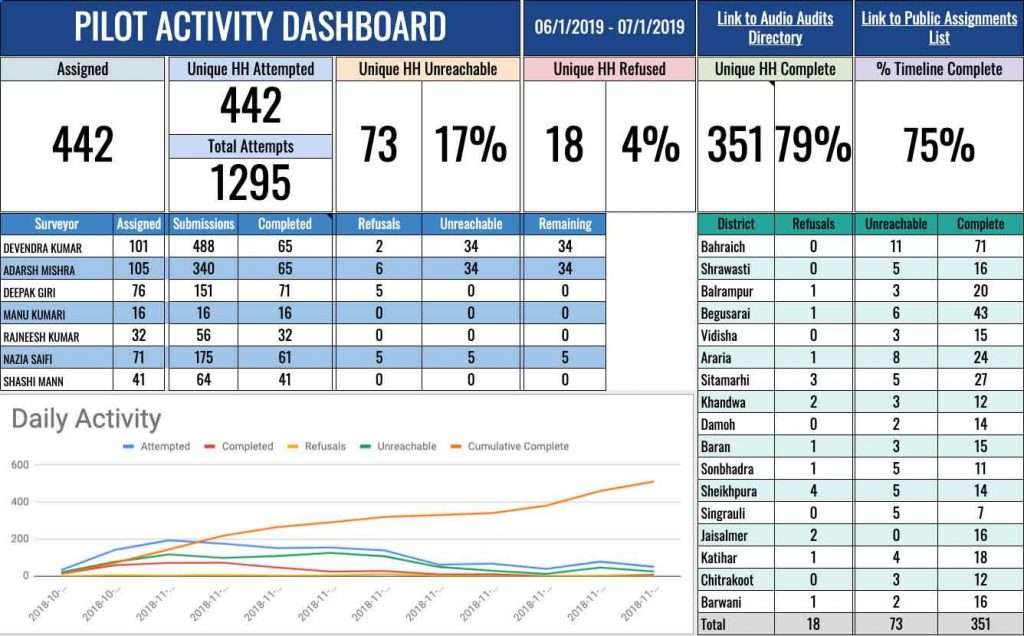
We use SurveyCTO forms to collect everything from survey data to field team expense reports and travel logs. By directly streaming survey variables into a private Google Sheets dashboard system, we can ingest data in near real-time to track the completion status of surveys, perform simple quality checks, calculate productivity metrics, and even process surveyor payments.
This workflow provides improved insight into field operations, without requiring technical expertise or relying on manual processing. As a result, we are able to identify systematic errors and productivity issues earlier, refine our payment model, collect expense reports in real-time, and aggregate travel logs, while reducing the time spent maintaining each of these workstreams.

We also use SurveyCTO and Google Sheets to enhance our training efforts. We remotely train surveyors in multiple regions simultaneously using video modules. We then deploy content quizzes in SurveyCTO, which allows us to train and test surveyors on a single, user-friendly tool and identify early on when survey teams misunderstand certain sections of the training. Team members at all levels can independently review and react to results that are automatically aggregated and visualized in these pre-built training dashboards.

Google Sheets has the advantages of being a familiar tool—therefore easy for non-technical staff to work with—and totally free. However, one major roadblock to a deeper integration with Google Sheets is the limit (at the time of writing) to 2 million cells per workbook. In surveys that have quite a few variables, this cap can be reached quickly and the workarounds are largely manual. This limitation, and the limited analytical and visualization powers of Google Sheets, prompted us to switch to SurveyCTO’s flexible API tool.
SurveyCTO’s API tool
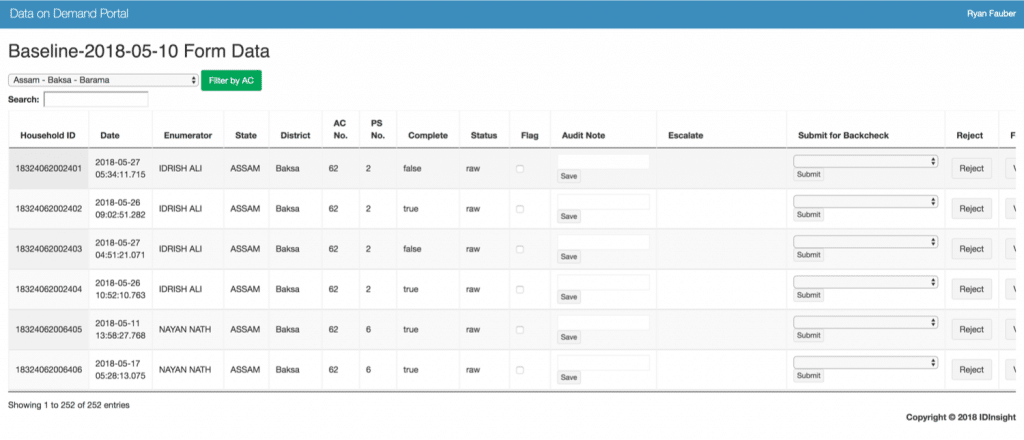
A more technically sophisticated tool is the Webhook API—a method of connecting to external databases and sending data to them as it comes in. By pushing data to a private database, we are able to connect to more advanced dashboard tools, run complex cleaning functions in real-time, send automated alerts based on incoming data using SendGrid (an email delivery platform that we describe further below), and use a custom front end application that allows users to interact with the data in a controlled environment. This application allows supervisors and users at all levels to flag incoming submissions, send notes, and escalate quality concerns to the central team.

In addition, the Webhook allows us to send media files (audio audits and images) directly to our cloud-based file storage (AWS S3) and share automatically-generated links with our quality monitors. Previously, sharing and reviewing these files was time-consuming and difficult to organize at-scale. We now use Python to automatically generate and send a list of media files with password-protected URLs. Our monitors click on the links, review the files, and record information about their quality in a SurveyCTO form, which triggers backchecks, spotchecks, and data resolutions.
By streamlining data ingestion and processing, using data effectively during the survey is much simpler and allows us to follow our next rule of thumb.
2. Decentralize field operations management
While dashboards can be useful for the central team, they also have huge potential to improve how field supervisors and surveyors themselves manage field operations. IDinsight’s central teams are typically small, and it can be cumbersome for them to manage daily updates from large field teams, which can consist of thousands of surveyors. Empowering local field supervisors to better manage their teams shrinks the feedback loop and allows the central team to focus on larger logistical or systematic quality control issues.
Oversight tools
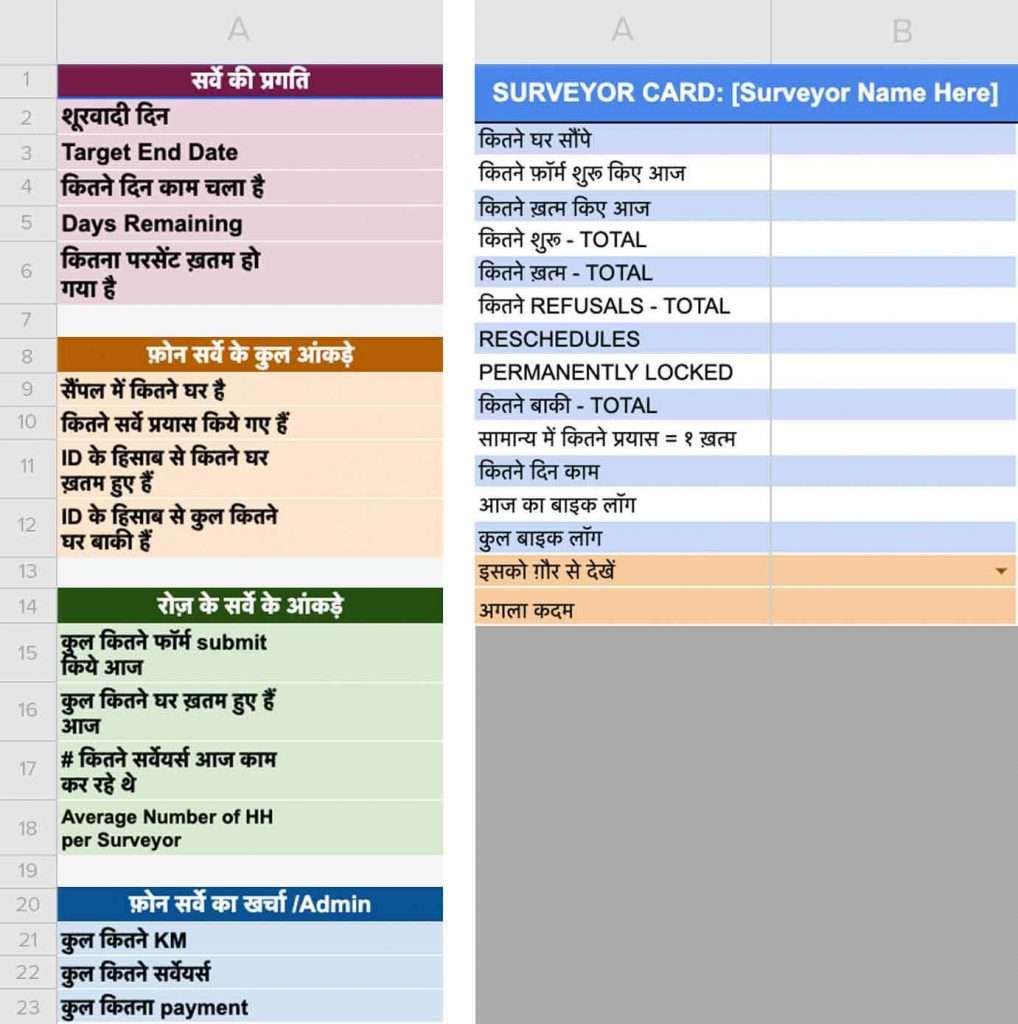
We designed tools and dashboards that enable field supervisors—many of whom are only using smartphones—to review incoming metrics and make faster and more informed decisions about targeting, improvement plans, and resource allocation. These oversight tools, powered by SurveyCTO’s integrations, allow supervisors to track surveyor performance via metrics like completed surveys, survey logic (quality) issues, attendance, and submitted expenses.
We applied the following three rules to create efficient oversight tools:
-
- Focus on the information that is essential to daily decision-making.
- Be thoughtful about how you instruct users to interact with the information.
- Structure the dashboards and tools so that they can be easily used on a phone.
We developed several dashboard prototypes, some using Google Sheets directly and some using Google Data Studio—a free dashboard tool that works well with data in Google Sheets.

Prioritizing metrics
When creating these tools, we advise that you follow agile software development principles and subject them to several rounds of user testing to improve the backend data pipeline. We also encourage you to think carefully about what you want to show and how the user should interact with the tool. There are many ways to optimize survey operations; your priorities should determine what your dashboard showcases and how your users ingest the information. Since there is limited space on any screen, be sure to prioritize metrics that inform decisions and always conduct pilots with a variety of user types: from the savvy techies to those using a smartphone for the first time. Often the metrics that the central team thinks are important may not be the information that field supervisors need to make daily decisions or lead team debriefs.
Now that you’re automatically cleaning the data and providing insights to users at all levels, how do you act on this information at-scale?
3. Communicate frequently with your field team using automated messages
For information that passes from the central team to the entire field team, we developed an automated message workflow that relies on incoming data and the email software SendGrid.
Targeted messaging for surveyor assignments
Using an automated messaging tool like SendGrid allows us to programmatically send general field announcements to the entire field team. However, the most effective application of this tool is to send targeted messages like personal surveyor assignments and quality reports. We can also track who opens their emails and when in order to identify which surveyors might be submitting bad data (if they did not open their assignments email but submitted a survey, chances are the data is falsified!). Not only are we able to send surveyors their personal survey assignments, but we direct them straight to the front door of their assigned households by generating Google Maps links from GPS points of our in-network households—a simple change in process that greatly increased efficiency for follow-up surveys.
In addition, we empower supervisors to update assignments in a protected Google Sheets file, which is then automatically pulled in to the daily assignment emails using Python. As a result, there is no lag in reassignments and the entire process is easily tracked, compared to our previous process, in which individual supervisors manually managed their region’s list of assignments —sometimes just in their heads!

Personalized productivity reports
After automatically running analysis on incoming survey data, we produce personalized productivity and quality reports and send them to surveyors on a weekly basis, while also copying their supervisors. This improves the quality of performance reviews and makes our productivity and quality bonus awards more transparent. Additionally, while these automated messages help regional team supervisors schedule fewer in-person debriefs, they also allow them to better identify and focus on the surveyors who need more guidance.
Using emails does come with some drawbacks—-many of our surveyors had never created an email account and needed training and practice to get used to the new application. We are currently testing an app-based communication tool similar to WhatsApp that allows for programmatic messaging, controlled group chats, and embedded videos.
Conclusion
These simple data pipeline improvements represent some of the first steps IDinsight has taken to automate much of the data collection process. They have allowed us to focus staff time on survey project areas that need it most, such as improving form design and identifying high-performing surveyors to reward and low-performing surveyors to better support.
The data system described also lays the groundwork for far more advanced innovations, like a machine learning-powered cleaning algorithm and totally automated survey deployment (from surveyor hiring to final report)—both of which we are currently developing, while continuing to use SurveyCTO as the backbone of our collection process. We are also experimenting with other innovations that combined will lead to a revolutionary survey model.
None of these improvements would have been possible without SurveyCTO’s sophisticated data integrations and the many rounds of user testing IDinsight underwent in both small pilots and full-scale tests. It was essential to test these integrations and workflows with actual survey teams and supervisors, who have valuable insight into how these tools can best operate in the field.
We are excited about what the future holds for our Data on Demand team and our partnership with SurveyCTO. We would be very interested in hearing how you or your organization has automated parts of the data collection process, and what you think of the guidelines outlined above. We are also happy to share the simple Python code, Google Sheets templates, and other field operations guides that we developed to automate emails, assignments, and tracking. Please do not hesitate to reach out at it@IDinsight.org!
This post was written by Ryan Fauber, Senior Product Lead at IDinsight.
IDinsight works with governments, multilaterals, foundations, and innovative non-profit organizations in Asia and Africa. We work across a wide range of sectors, including agriculture, education, health, governance, sanitation, and financial inclusion. We have offices in Dakar, Johannesburg, Lusaka, Manila, Nairobi, New Delhi, San Francisco, and Washington DC. To learn more, visit www.IDinsight.org or connect with us at inquire@IDinsight.org.


